ViewX
ViewX — v2.4
ViewX es un paquete moderno de Python diseñado para generar páginas HTML interactivas, dashboards dinámicos y visualizaciones inteligentes que se adaptan automáticamente a los objetos agregados por el usuario.
Este proyecto ofrece una solución ligera, intuitiva y escalable, ideal para crear interfaces visuales llamativas sin depender de frameworks pesados… aunque una parte se encuentra basada en Streamlit mediante dependencias opcionales.
Características principales
- Rápido y minimalista: cero dependencias pesadas por defecto.
- API intuitiva: crea páginas y dashboards en segundos.
- Diseño adaptativo: cada componente se acomoda automáticamente.
- Modo HTML: genera páginas
.htmltotalmente autónomas. - Extensible: añade tus propias plantillas y módulos personalizados.
- Visión a futuro: pensado para expandirse a interfaces inteligentes.
Instalacion
pip install viewx
Ejemplo rápido
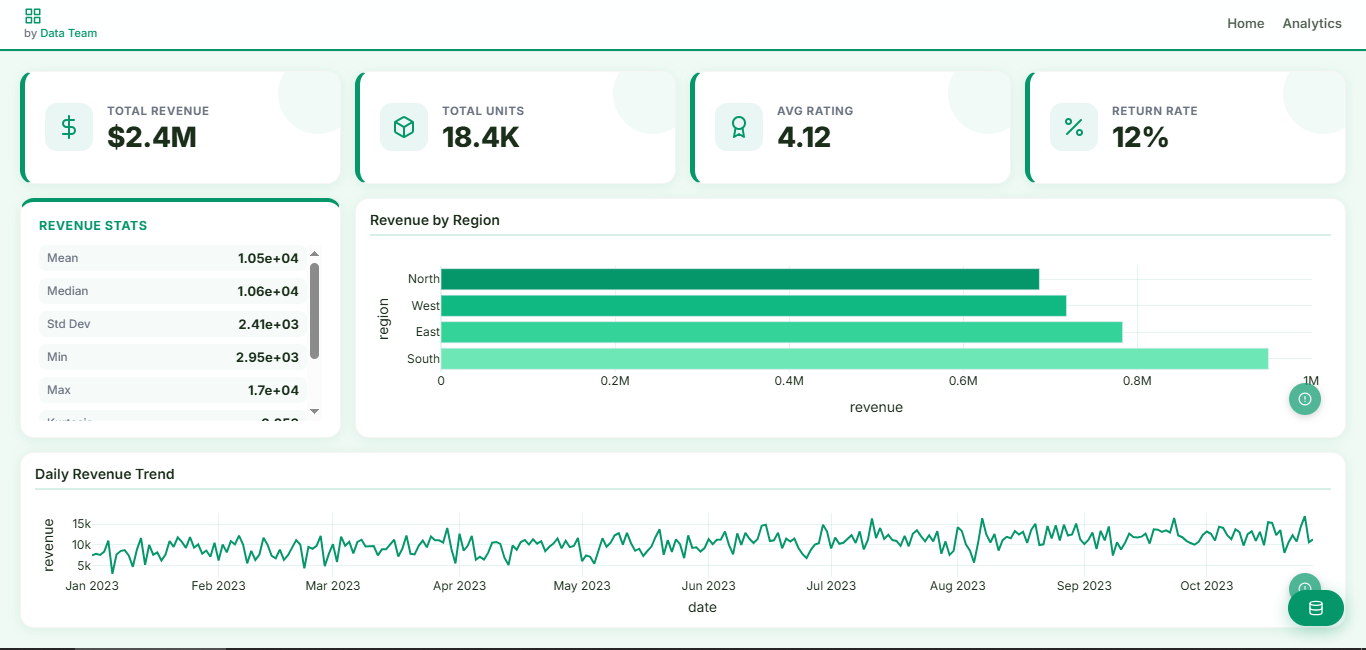
Crear un DashBoard HTML
df = pd.DataFrame({
    "date": dates, "region": regions, "product": products,
    "revenue": revenue_str, "costs": costs.round(2),
    "units": units, "rating": rating, "returned": returned,
})
df["revenue"] = pd.to_numeric(
    df["revenue"].str.replace(r"[$,]", "", regex=True), errors="coerce"
)

fig_bar = px.bar(
    df.groupby("region")["revenue"].sum().reset_index().sort_values("revenue"),
    x="revenue", y="region", orientation="h", color="region",
    color_discrete_sequence=["#059669", "#10B981", "#34D399", "#6EE7B7"],
)
fig_bar.update_layout(showlegend=False)

fig_line = px.line(
    df.groupby("date")["revenue"].sum().reset_index(),
    x="date", y="revenue", color_discrete_sequence=["#059669"],
)

dash = HTML(
    title="Manual Dashboard", theme="modern_green",
    cols=12, rows=9, gap=14, padding=20,
    navbar={"title": "Manual Dashboard",
            "items": [{"label": "Home", "link": "#"}, {"label": "Analytics", "link": "#"}]},
    authors=[{"name": "Data Team", "email": "data@acme.com"}],
    data_button=True, df=df,
)

dash.add_valuebox("Total Revenue", "$2.4M",  icon_key="dollar",  row=1, col=1,  height=2, width=3)
dash.add_valuebox("Total Units",   "18.4K",  icon_key="box",     row=1, col=4,  height=2, width=3)
dash.add_valuebox("Avg Rating",    "4.12",   icon_key="award",   row=1, col=7,  height=2, width=3)
dash.add_valuebox("Return Rate",   "12%",    icon_key="percent", row=1, col=10, height=2, width=3)

dash.add_infobox(df=df, variable="revenue",
    info=["mean", "median", "std", "min", "max", "kurtosis", "skewness", "nulls"],
    title="Revenue Stats", row=3, col=1, height=4, width=3)
dash.add_chart(fig=fig_bar, title="Revenue by Region",
    row=3, col=4, height=4, width=9, show_info_btn=True,
    _info_stats={"Regions": "4", "Total": "$2.4M"})
dash.add_chart(fig=fig_line, title="Daily Revenue Trend",
    row=7, col=1, height=3, width=12, show_info_btn=True)

dash.generate("demo6_manual.html")
Crear una Presentacion
from viewx.Slides import (
    Presentation, Slide, Grid,
    Title, Subtitle, Text, BulletList,
    BarPlot, PiePlot, IconStat, RotatingIcon, MovingFigure,
    Button, Link
)

pres = Presentation("Demo Viewx.Slides", theme="dark")
pres.font("Inter").meta(author="Viewx", date="2026")

with Slide(title="Bienvenida al Motor", index=1, notes="Slide de portada del motor Viewx.Slides."):
    Title("Slides Engine v1.0").center("x").pos(top=10).zoom_in(duration=1.2)
    Subtitle("Framework de presentaciones dinámicas en Python").center("x").pos(top=26).slide_in("right")
    Text(
        "Este motor permite crear presentaciones HTML interactivas de forma programática, con posicionamiento, dimensiones, animaciones y componentes reutilizables.",
        color="#ffffff",
    ).center("x").pos(top=42).size(width="68%").align("center").fade_in(delay=0.3)
    RotatingIcon("gear", size=64, color="#00f2ff").pos(right=6, top=8)
    MovingFigure("circle", color="rgba(0,242,255,.22)", size=180, path="drift").pos(left=8, bottom=10).z(1)
    Button("Ver GitHub", href="https://github.com/").center("x").pos(top=68).fade_in(delay=0.55)

with Slide(title="Componentes", index=2, bg="linear-gradient(135deg,#111827,#312e81)"):
    Title("Componentes incluidos").pos(left=6, top=8).slide_in("left")
    BulletList([
        "Textos, títulos, subtítulos y listas.",
        "Imágenes, vídeos, hipervínculos y botones.",
        "Estadísticas con iconos y figuras animadas.",
        "Gráficos interactivos basados en Plotly.",
    ]).pos(left=8, top=30).size(width="48%")
    with Grid(columns=3, gap=18).pos(left=58, top=26).size(width="36%"):
        IconStat("check", "12+", "Componentes")
        IconStat("chart", "4", "Gráficos")
        IconStat("bolt", "CSS", "Animaciones")
    Link("Ir a la portada", href="#").pos(left=8, bottom=12).link_to_slide(1)

with Slide(title="Gráficos", index=3):
    Title("Plotly integrado").pos(left=6, top=7).zoom_in()
    Text("Los gráficos se exportan como HTML interactivo usando Plotly por CDN.").pos(left=7, top=22).size(width="42%")
    BarPlot(["A", "B", "C", "D"], [24, 38, 31, 45], title="BarPlot").pos(left=7, top=38).size(width="40%", height="42%")
    PiePlot(["Python", "HTML", "CSS"], [55, 30, 15], title="PiePlot", hole=0.35).pos(left=54, top=25).size(width="38%", height="52%")

path = pres.export("viewx_slides_demo.html")
print(path)
Crear un Reporte
from viewx.datasets import load_dataset
import seaborn as sns
import matplotlib.pyplot as plt

# ===============================
# 1️⃣ CREAR REPORTE
# ===============================
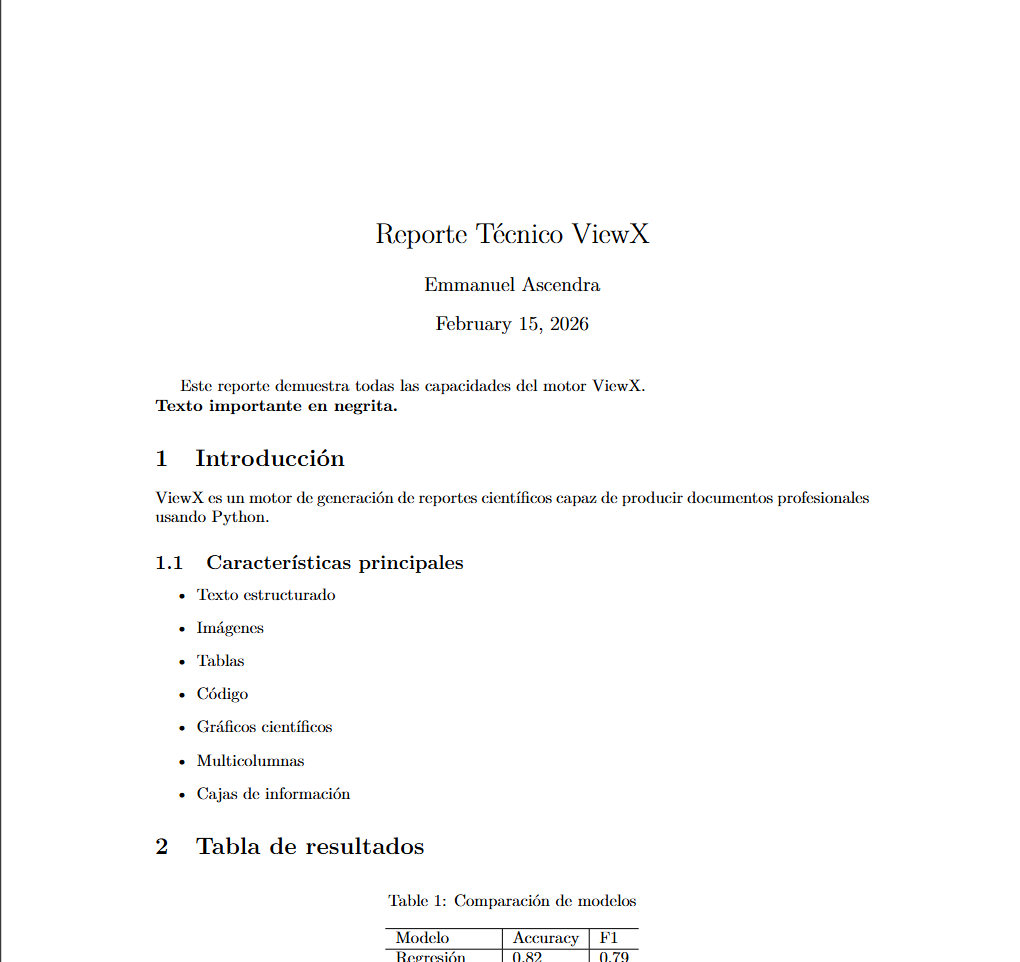
r = Report(
    title="Reporte Técnico ViewX",
    author="Emmanuel Ascendra"
)

# ===============================
# 2️⃣ TEXTO
# ===============================
r.add_text("Este reporte demuestra todas las capacidades del motor ViewX.\n")
r.add_text("Texto importante en negrita.", bold=True)

# ===============================
# 3️⃣ SECCIONES
# ===============================
with r.doc.create(r.add_section("Introducción")):
    r.add_text(
        "ViewX es un motor de generación de reportes científicos "
        "capaz de producir documentos profesionales usando Python."
    )

# ===============================
# 4️⃣ SUBSECCIÓN
# ===============================
with r.doc.create(r.add_subsection("Características principales")):
    r.add_itemize([
        "Texto estructurado",
        "Imágenes",
        "Tablas",
        "Código",
        "Gráficos científicos",
        "Multicolumnas",
        "Cajas de información"
    ])

# ===============================
# 5️⃣ TABLA
# ===============================
with r.doc.create(r.add_section("Tabla de resultados")):
    r.add_table(
        headers=["Modelo", "Accuracy", "F1"],
        rows=[
            ["Regresión", 0.82, 0.79],
            ["Árbol", 0.91, 0.88],
            ["Red neuronal", 0.94, 0.92],
        ],
        caption="Comparación de modelos"
    )

# ===============================
# 6️⃣ IMAGEN
# ===============================
with r.doc.create(r.add_section("Visualización")):
    r.add_image(
        path="assets/ejemplo.png",
        caption="Imagen de prueba",
        width="0.6\\linewidth"
    )

# ===============================
# 7️⃣ CÓDIGO
# ===============================
with r.doc.create(r.add_section("Código de ejemplo")):
    r.add_code("""
import numpy as np

x = np.linspace(0, 10, 50)
y = np.sin(x)
""")

# ===============================
# 8️⃣ MULTICOLUMNAS
# ===============================
with r.doc.create(r.add_section("Análisis en dos columnas")):
    r.begin_multicols(2)

    r.add_text(
        "Este bloque demuestra cómo dividir el contenido "
        "en múltiples columnas dentro del mismo documento."
    )

    r.add_itemize([
        "Ideal para papers",
        "Mejora lectura",
        "Ahorra espacio"
    ])

    r.end_multicols()

# ===============================
# 9️⃣ CAJA DESTACADA
# ===============================
with r.doc.create(r.add_section("Nota importante")):
    r.add_box(
        title="Observación clave",
        content="Todos los elementos se generan directamente desde Python.",
        color="green!20"
    )

# ===============================
# 🔟 GRÁFICO SIMPLE
# ===============================
with r.doc.create(r.add_section("Gráfico simple")):
    r.add_plot(
        x=[0, 1, 2, 3, 4],
        y=[0, 1, 4, 9, 16],
        caption="Crecimiento cuadrático"
    )

# ===============================
# 1️⃣1️⃣ MULTIGRÁFICO
# ===============================
with r.doc.create(r.add_section("Gráficos múltiples")):
    r.add_multiplot(
        plots=[
            ([0, 1, 2, 3], [0, 1, 4, 9]),
            ([0, 1, 2, 3], [0, 1, 8, 27]),
        ],
        caption="Comparación de funciones"
    )

# ===============================
# 1️⃣2️⃣ SALTO DE PÁGINA
# ===============================
r.new_page()
r.add_text("Contenido en una nueva página.")

# ===============================
# 1️⃣3️⃣ GENERAR PDF
# ===============================
r.build("reporte_demo")
Analizar Datos en DataMatrix
import pandas as pd
import numpy as np
from viewx.DataMatrix import DataMatrix

# 1. Crear un Dataset sintético que simule datos bibliométricos
data = {
    'Authors': [
        'Aria, M; Cuccurullo, C', 'Aria, M; Smith, J', 'Cuccurullo, C',
        'Doe, J', 'Smith, J; Doe, J', 'Aria, M', 'Brown, A', 'Brown, A; Smith, J',
        'Gomez, P', 'Gomez, P; Aria, M', 'Doe, J', 'White, S', 'White, S; Brown, A',
        'Black, R', 'Black, R; Gomez, P', 'Green, T', 'Green, T; Aria, M',
        'Doe, J', 'Smith, J', 'Cuccurullo, C'
    ],
    'Year': [2017, 2017, 2018, 2018, 2019, 2019, 2020, 2020, 2021, 2021, 2022, 2022, 2023, 2023, 2024, 2024, 2025, 2025, 2026, 2026],
    'Journal': [
        'Journal of Informetrics', 'Journal of Informetrics', 'Scientometrics',
        'Scientometrics', 'Nature', 'Nature', 'Science', 'Science',
        'Journal of Informetrics', 'Scientometrics', 'Nature', 'Science',
        'Journal of Informetrics', 'Scientometrics', 'Nature', 'Science',
        'Journal of Informetrics', 'Scientometrics', 'Nature', 'Science'
    ],
    'Citations': np.random.randint(0, 100, size=20),
    'Abstract': ['Resumen de prueba ' + str(i) for i in range(20)],
    'Keywords': ['bibliometrics; R', 'python; data science', 'metrics; science', 'analysis', 'data', 'python', 'r', 'metrics', 'science', 'mapping', 'analysis', 'data', 'python', 'r', 'metrics', 'science', 'mapping', 'analysis', 'data', 'python'],
    'Duplicate_Col': [1] * 20, # Columna constante para alerta
    'Missing_Col': [np.nan] * 15 + [1, 2, 3, 4, 5] # Columna con muchos nulos
}

df = pd.DataFrame(data)

# Añadir filas duplicadas para probar limpieza
df = pd.concat([df, df.iloc[:2]], ignore_index=True)

print("Dataset creado con", len(df), "filas.")

# 2. Usar DataMatrix
dm = DataMatrix(df)

# Limpiar datos
dm.clean_data(drop_duplicates=True, fill_na=True)

# Generar reporte
report_path = dm.generate_report("demo_datamatrix_report.html", title="Análisis Bibliométrico de Prueba")

print(f"Reporte generado exitosamente en: {report_path}")
Contribuciones
¡Todas las ideas, mejoras y plantillas son bienvenidas! ViewX está diseñado para crecer y evolucionar con la comunidad.
Contacto:
ascendraemmanuel@gmail.com